
← All work
Dashboard · Machine learning
Dashboard · Machine learning
NYC real estate investor dashboard with a home price estimator
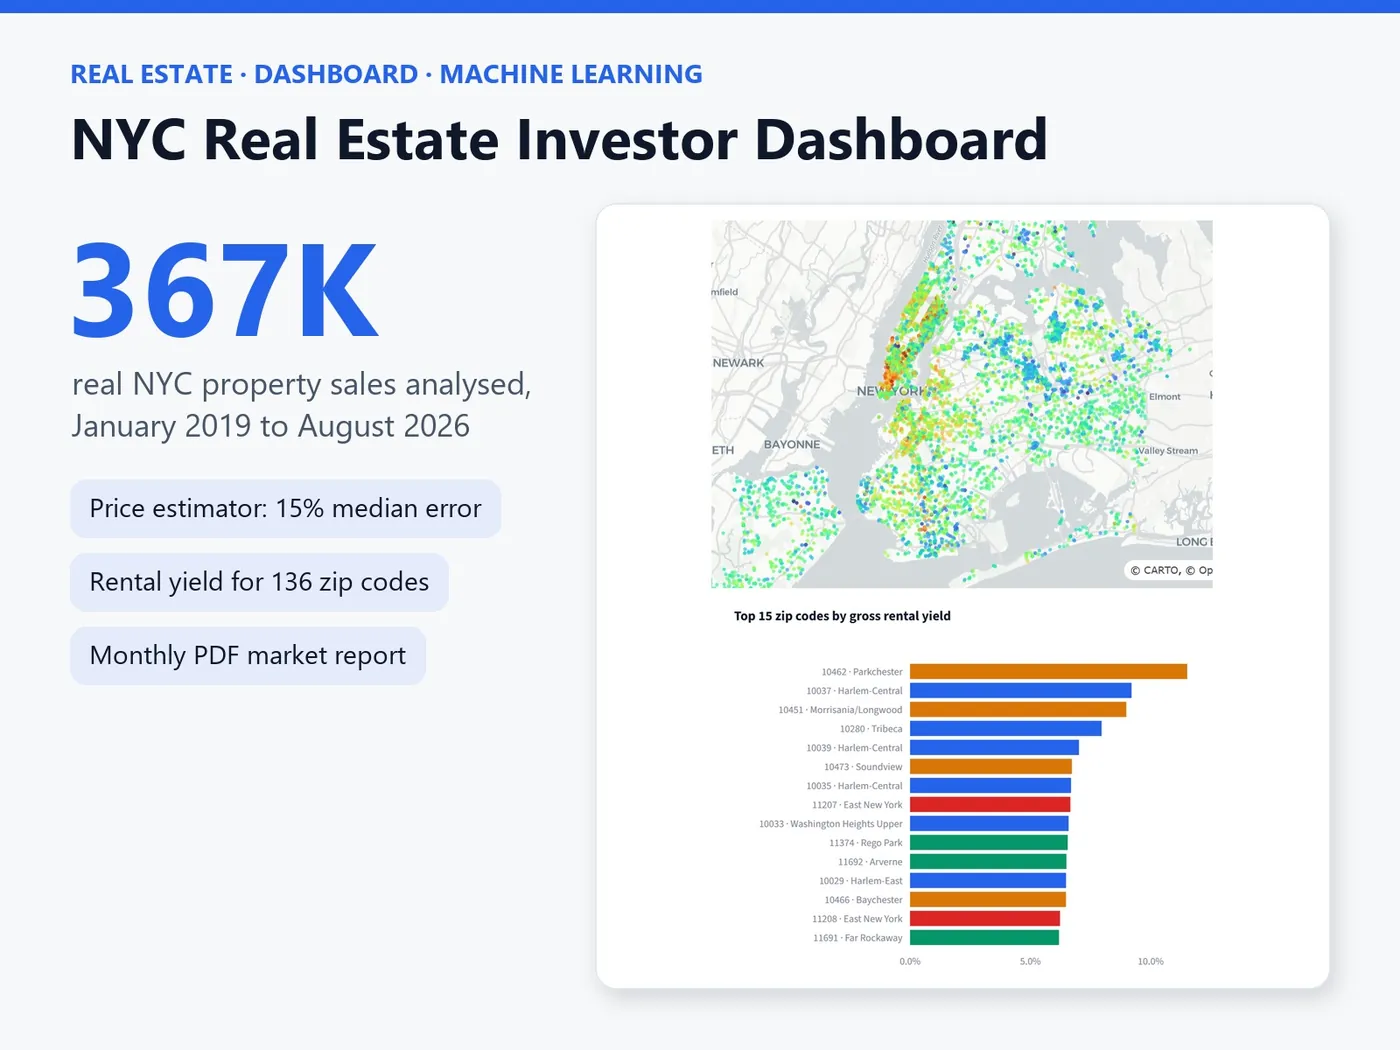
An interactive dashboard on 367,189 real New York City property sales: market trends, neighbourhoods, a home price estimator with comparable sales, and rental yields by zip code.
367K
real property sales, 2019 to 2026
15.3%
median price error on unseen 2026 sales
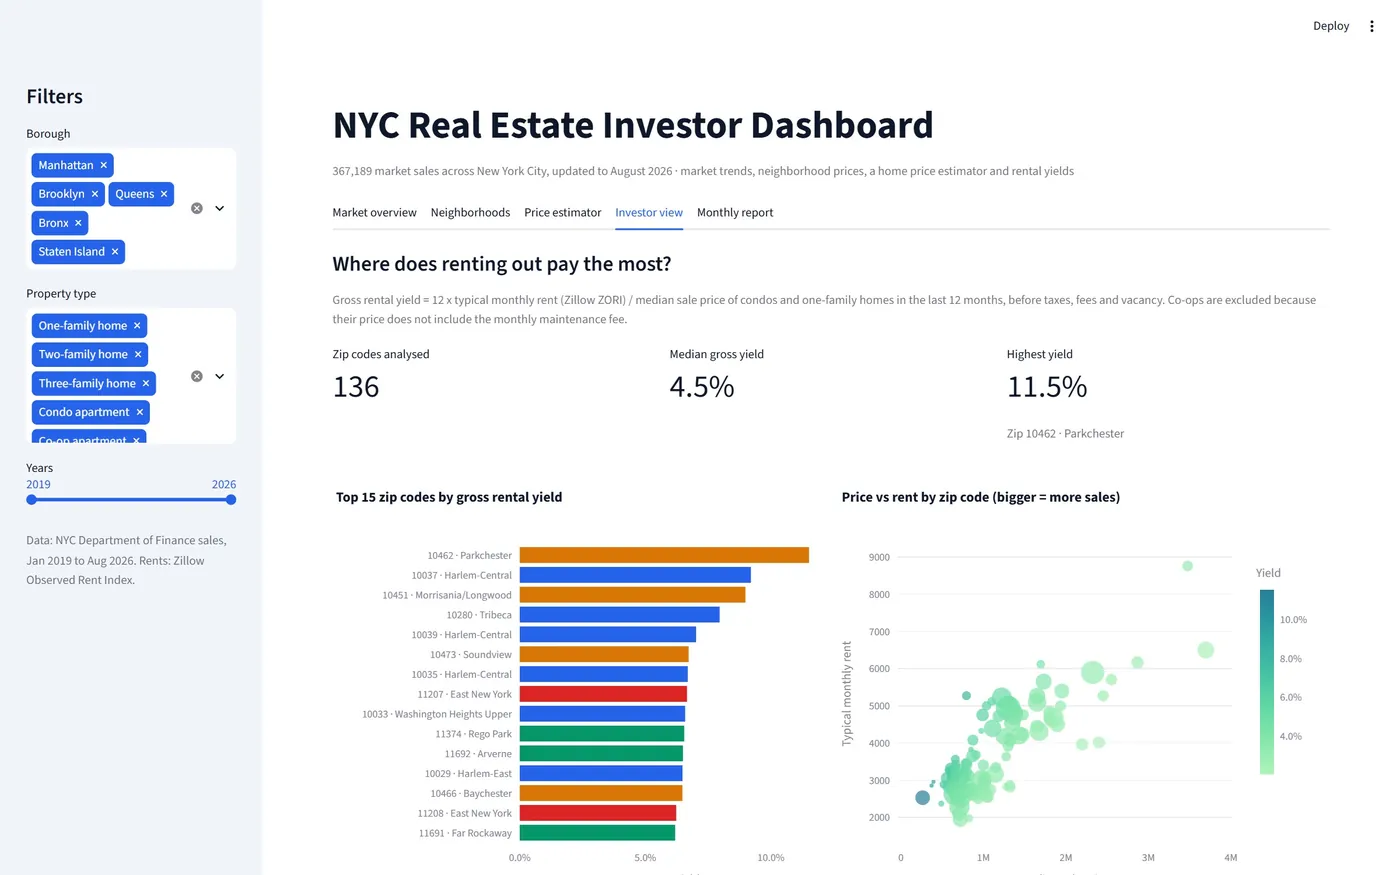
136
zip codes with rental yields
The problem
Property investors jump between sales records, rent indexes and spreadsheets to answer simple questions: what is this home worth, which areas are rising, and where do rents pay best?
The goal: one dashboard that answers all three with real data.
What I built
- Data: 367,189 NYC property sales (January 2019 to August 2026), Zillow rent data and US Census zip code centres, downloaded and cleaned by script.
- Market overview: sales volume, median price and price per sq ft with year-over-year change, by borough.
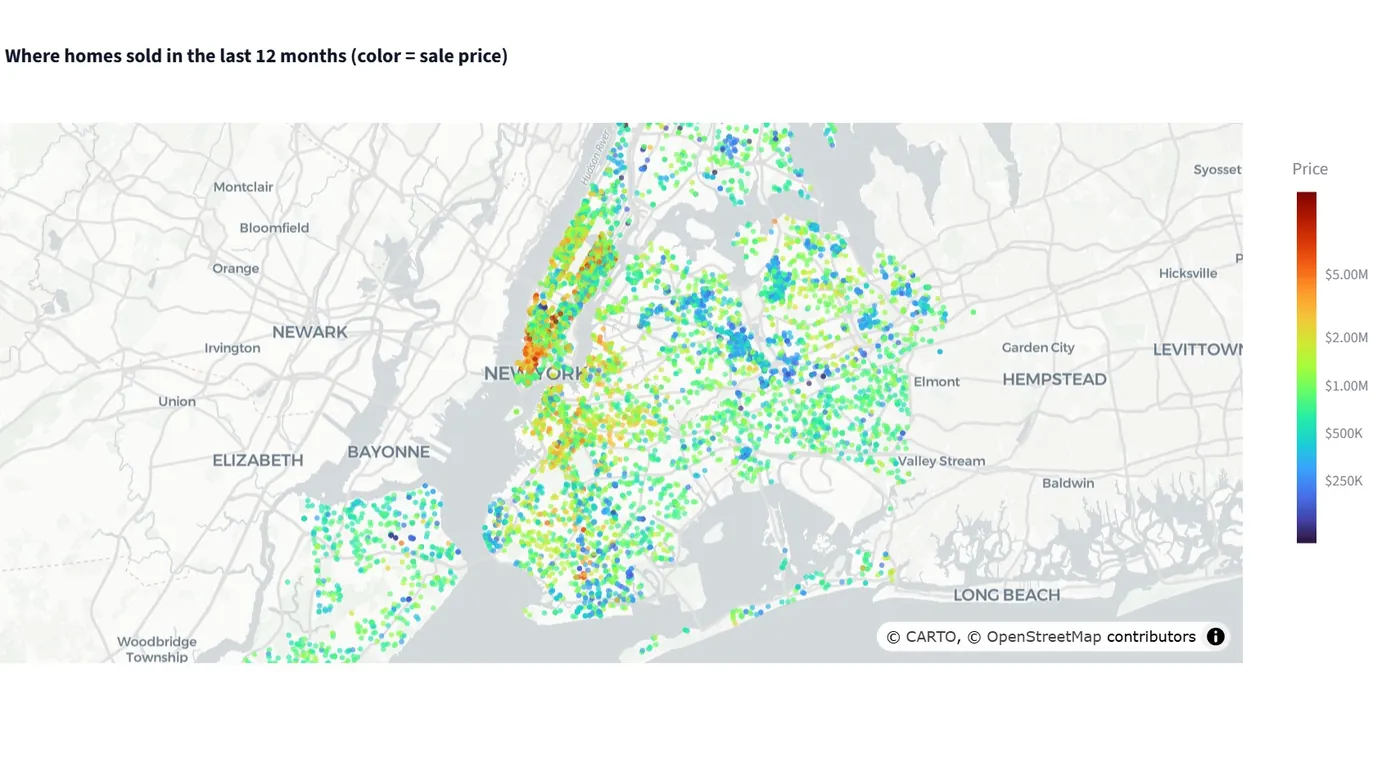
- Neighbourhoods: fastest-rising areas compared like for like (houses with houses, condos with condos), a sortable table and a map.
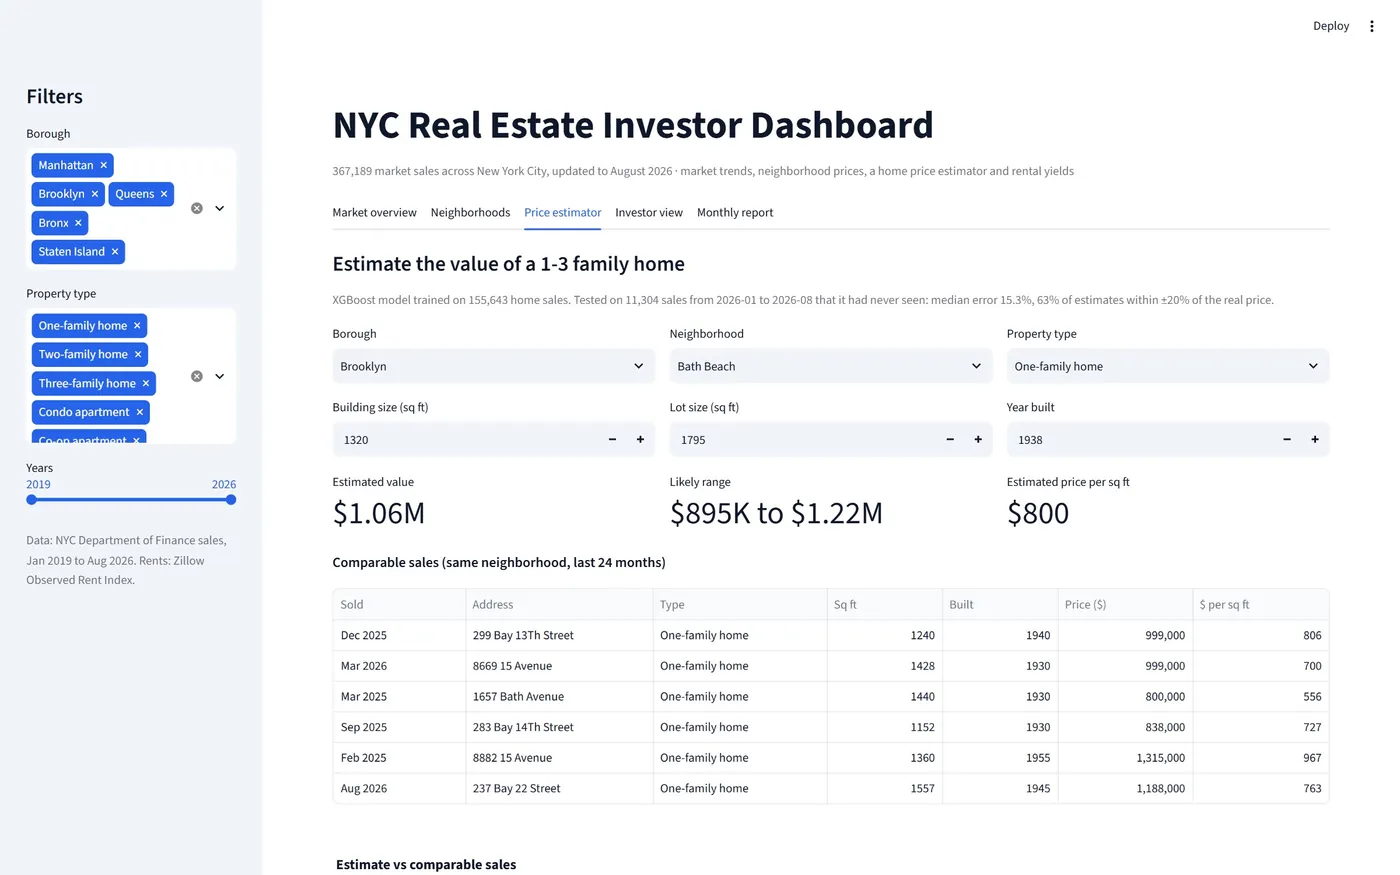
- Price estimator: an XGBoost model trained on 155,643 sales of 1-3 family homes, with a likely price range and the 6 most comparable recent sales.
- Investor view: gross rental yield for 136 zip codes, price vs rent, and an automatic monthly PDF market report.
The result
The price estimator was tested on 11,304 sales from 2026 that it had never seen:
| Metric | Model | Simple baseline |
|---|---|---|
| Median error | 15.3% | 22.7% |
| Estimates within ±20% | 63% | - |
Screens
Next case studyPower BI Sales Dashboard
→